There are a number of factors that impact your business revenue and determine how well your website meets visitors’ needs. Among them, page load time, the number of pages per session and the bounce rate.
According to a 2018 study by a mobile marketing agency LEAD9 and the Kiev International Institute of Sociology, up to 45% of all adult residents of Ukraine were using smartphones. Over the past 2 years, the smartphone penetration rate in Ukraine has increased by 26%. 54.5% of Ukrainians use mobile devices to access the Internet.

According to another study conducted by Promodo over the top e-commerce websites in Central and Eastern Europe, website load speed is one of the decisive factors influencing user behavior.
Page load time, the number of pages per session and bounce rates have a direct effect on the revenue of your online business and your website’s ability to meet the needs of its visitors. In this regard, consider the following:
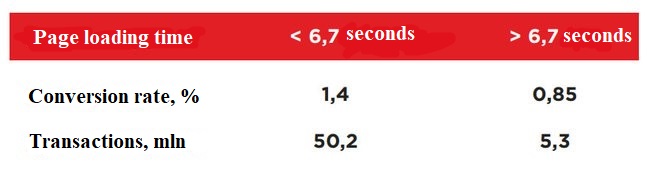
- The average loading time for an e-commerce website’s page is 6.7 seconds;
- Websites with page loading time of more than 6.7 seconds are 9 times less likely to sell.
If the performance of an e-commerce project is below the market average, its owners should have a vested interest in finding the causes and eliminating them.
What is Lighthouse?
In early 2018, Google released Lighthouse, a tool that can help you get an idea of how to improve the quality of your website pages. There are five page audit categories in Lighthouse reports:
- Performance
- Progressive Web App
- Accessibility
- Best Practices
- SEO.
In November 2018, Google released a new version of PageSpeed Insights using Google Lighthouse as its analysis engine.
Audit of 30 largest online stores in Ukraine
To conduct the audit, we’ve used the latest Lighthouse 4.1.0. The audit was made for the main pages of the websites.
The Performance scores may vary slightly from session to session. That’s why we used the average score for 3 audits.
Results
SEO audit helps evaluate your website’s search engine ranking. Lighthouse helps improve your search ranking by assessing the website’s optimization.
- The average score for SEO audit was 97 out of 100.
- The lowest score, 75 out of 100, was assigned to www.letu.ua.
Accessibility audit helps identify how convenient it is for people, people with disabilities in particular, to use the website.
- The average score for the websites in the review was 54 out of 100.
- The maximum score of 74 out of 100 was assigned to www.yakaboo.ua.
- The minimum score of 32 was assigned to www.watsons.ua.
The Best Practices category lists the most effective methods for optimizing website performance. Lighthouse keeps changing its tests to meet the current standards for web technologies and web development. A good score here would also indicate that your website meets the current standards and trends.
- Eldorado.ua, avtozvuk.ua, privatmarket.ua scored 93 out of 100.
- Mobilluck.com.ua got the lowest score among the websites in check, 50 out of 100.
Now, let’s take a closer look at the two remaining criteria used to evaluate the quality and speed of a website. Page performance is assessed by the following time-based metrics:

- First Contentful Paint (FCP) — the time from navigation to the time when the browser renders the first bit of content, an image or a text block.
- Time to Interactive (TTI) — a metric measuring how long it takes for a web page to become fully available for users to interact with.
- PageSpeed Insights (PSI) — reports on the performance of a page on both mobile and desktop devices. Speed Index is a metric indicating how quickly the contents of a page are visibly populated. Lighthouse takes screenshots of a webpage while it’s being loaded and calculates the speed index, analyzing the difference between the first and the last visual change.
- First Meaningful Paint (FMP) — the time needed for a page’s primary content to appear on the screen.
- First CPU Idle — the time at which the page becomes sufficiently able to handle manual user input.
- Estimated Input Latency (EIL) — the time in milliseconds, needed for the application to respond to user actions during the busiest 5 seconds of page load. If this score exceeds 50 ms, it may seem to users that your application is running with delays.
According to Lighthouse, most websites demonstrated low productivity scores. That is, these websites were slower than they could be. The average score was 35.8 out of 100.
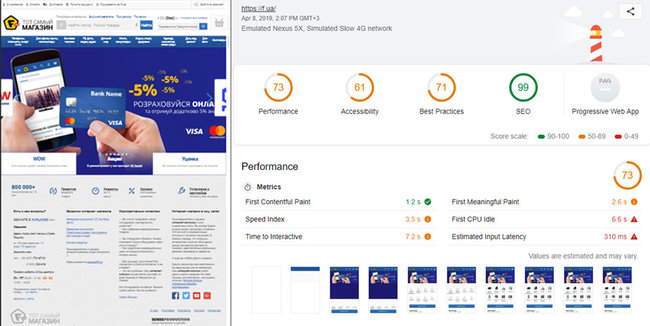
F.ua, an online retailer of electronics and home appliances f.ua, got the best score of 73 out of 100.
In comparison, the website of EVA, an offline chain of cosmetics stores, performed the worst with a 0 score.

Lighthouse limits bandwidth to simulate mobile connections since it focuses on measuring performance on mobile devices.
Progressive web apps (PWA) are evaluated by the three key factors: speed, reliability, and ability to engage.
- A website is Fast if it’s able to quickly exchange data over the network quickly, the interface should be smooth and responsive.
- The website is Reliable if the application page is loaded and displayed immediately, regardless of the status and quality of the network connection.
- The website is Engaging if it allows making user experience with the application comfortable and enjoyable, encouraging them to visit again.
The web app performance study of the niche Ukrainian retailers showed that the average PWA score in the market was 42 out of 100.
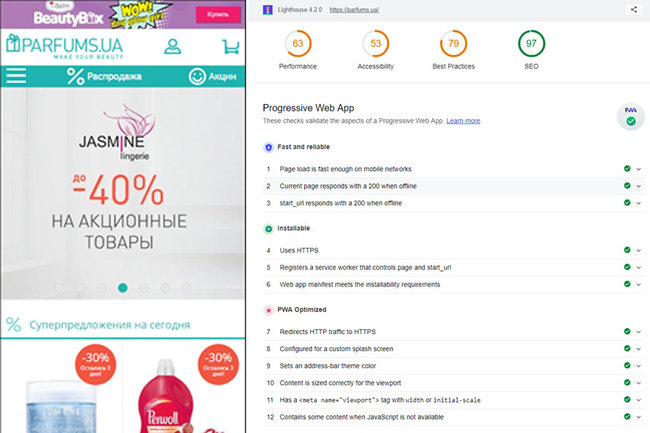
Parfums.ua and makeup.com.ua performed the best in the number of tests, with scores of 97 and 90, correspondingly.

Chrome User Experience Reports
You can use the PageSpeed Insights (PSI) tool to see the data on how convenient it is for visitors to use the website. The data is obtained from the Chrome User Experience Report (CrUX).
CrUX contains the main usability metrics obtained through the analysis of real data, which allows website owners to compare their performance with other web properties.
This allows you to monitor the strengths and weaknesses in a website’s usability over time.
In addition, Google has released a CrUX Dashboard based on Data Studio. The dashboard automatically synchronizes with the latest BigQuery datasets, it’s easy to customize and share with other members of your team.
Below are a few examples from the dashboard:

Green, orange red bars represent the percentages of users who get a website loading at fast, medium and slow speed, respectively.
How to Reduce Page Load Time for a Website
Our research has shown that nowadays when it is necessary to make maximum efforts to optimize website performance on mobile devices, few of the top ten websites have all that it takes to be among the leaders.
First of all, developers need to focus on the three metrics that allow achieving good results:
- First Meaningful Paint
- Speed Index
- Time to Interactive
Start with solving problems that don’t call for complex solutions. For example, here are a few simple, but effective ways to improve website performance:
- Reduce the file size of page elements (such as, HTML, JavaScript and CSS, as well as image files).
- Use responsive images.
- Optimize images using tools like MozJPEG, Pingo, Lossy GIF, SVGOMG.
- Reduce the number of requests for your website’s files, by combining the files or using lazy loading.
- Prioritize critical CSS required to render a webpage.
- Avoid executing code that is not required for the initial display of a webpage.
It’s worth making Lighthouse your tool for constant analysis while developing and optimizing your website. We suggest that you monitor all the indicators for different types of pages (main, brand, category, product pages) on a regular basis, optimize these metrics and keep them at an optimal level.
About the Author: Vitaly Galkin is the head of IT department at Promodo Digital Marketing.